Performance Measurement & Metrics
One of the keys to maintaining quality delivery throughout an Agile project is measuring the most important aspects of the team’s performance. Examples of metrics used in Agile are shown below.
Agile Topics & Concepts
Agile Metrics
FAS-IT is rolling out an initial set of metrics with the goal of evolving an effective practice of collecting valuable data, communicating it, and using it to inform decisions. For additional information on metrics that can be used in Agile, visit the GSA Lean-Agile Center of Excellence Confluence page.
Objectives:
- Create visibility and shared awareness in the value being created and benefit of the work
- Quantify and show the impact of efforts and how they compare with the expected results
- To encourage the right behaviors and provide data points that show the impact of the behavior change over time
- To inform decision making
- To communicate status, benefit, and value to the leadership, stakeholders, and customers
As FAS IT continues to deliver modernized solutions, regularly monitoring performance is essential. While multiple metrics exist for teams to adopt, FAS-IT will initially focus on four common categories where metrics can be combined to provide insight into performance:
- Productivity
- Quality
- Predictability
- Team Stability
Categories and Metrics
Cycle Time
Category: Productivity
What: Cycle time is a measure of the elapsed time when work starts on an item (story, task, bug etc.) until it's ready for delivery. Cycle time tells how long (in calendar time) it takes to complete a task (can be averaged over time) to report how long a team needs to complete a task. The shorter the cycle time, the more consistently things are getting done.
Why: Identifies efficiencies in delivering value, but should be put into context when considering reported defects. Indicator of throughput.
How: Automatically measure when work starts and when work is done. (Jira).
Escaped Defects
Category: Quality
What: Escaped Defects measures the number of bugs or defects reported once the product is in production - in use by the customer.
Why: Monitors quality of the solution over time, the lower defect rate the more likely the customer (and team) is satisfied. A low number of escaped defects indicates a team that has a shared responsibility for quality (e.g., increased focus on automated testing).
How: Automatically measure leveraging Jira to report defects reported related to production releases.
Planned-to-Done
Category: Predictability
What: Planned-to-Done represents a measurement of how well a team plans (commits to complete) versus what gets done in a given time. Expected to stabilize once norms are established, and even improve over time. This measures only the items that are committed during sprint planning and does not include any items added or removed during the sprint.
Why: Measures the ability to scope the appropriate amount of work in a given time and how well a team can complete what is planned (effectiveness of Scrum Master).
How: Automatically measure leveraging Jira to report defects reported related to production releases.
Team Morale / Turnover
Category: Team Stability
What: Team Turnover provides an indication of how content the team members are.
Why: Indicates the capacity for teams to adapt in healthy and positive ways. Also provides context to other metrics - a low score can indicate emerging issues.
- Is the team getting burned-out?
- Is team capacity being managed?
- Are the right skill sets available?
- Is the Scrum Master effective?
How: Formula:(Number of team members that left / Average number of team members) X 100
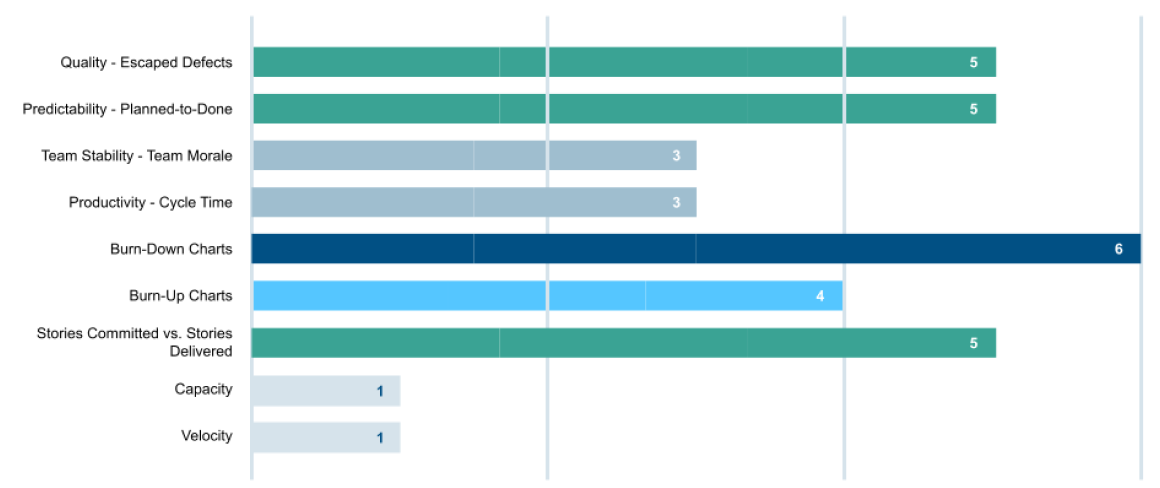
Program-Level Metrics
The following metrics are captured by the FAS-IT divisions at the program level, as indicated below:
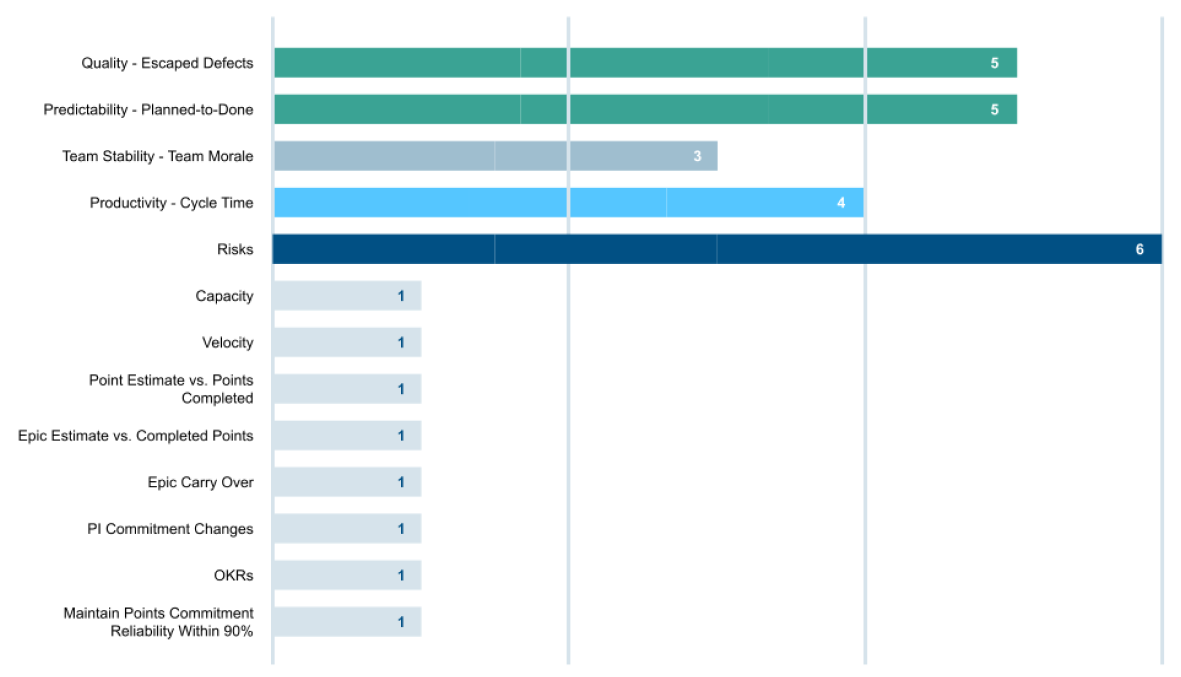
Execution-Level Metrics
The following metrics are captured by the FAS-IT divisions at the execution level, as indicated below: