
Macro-Patterns
Macro-Patterns represent system-level diagrams of major, common and reusable systems components. They are intended to provide a level of standardization and commonality.
Macro-Patterns
Further in, FAS-IT currently has several "macro-patterns" that are used to talk about and evaluate system plans. These represent a technology agnostic view of various system types and are designed to promote discourse on technology possibilities. Many concepts and patterns are contained in these and they are readily recognizable by almost anyone who has been involved in building transactional, data flow or analytical systems. A number of systems within FAS might need to use more than one of the following macro-patterns since, for instance, a system that is primarily transactional (data entry) might also need to do some light analytics to support reporting. A system doesn't have to use just one of the macro-patterns.
To provide an easy bridge, our "conceptual icon set" loosely follows the AWS color scheme for groupings where orange is used for "compute" components and purple is used for "networking" or "analytics" components, etc. along with roughly resembling AWS icons.
Transactional Macro-Pattern
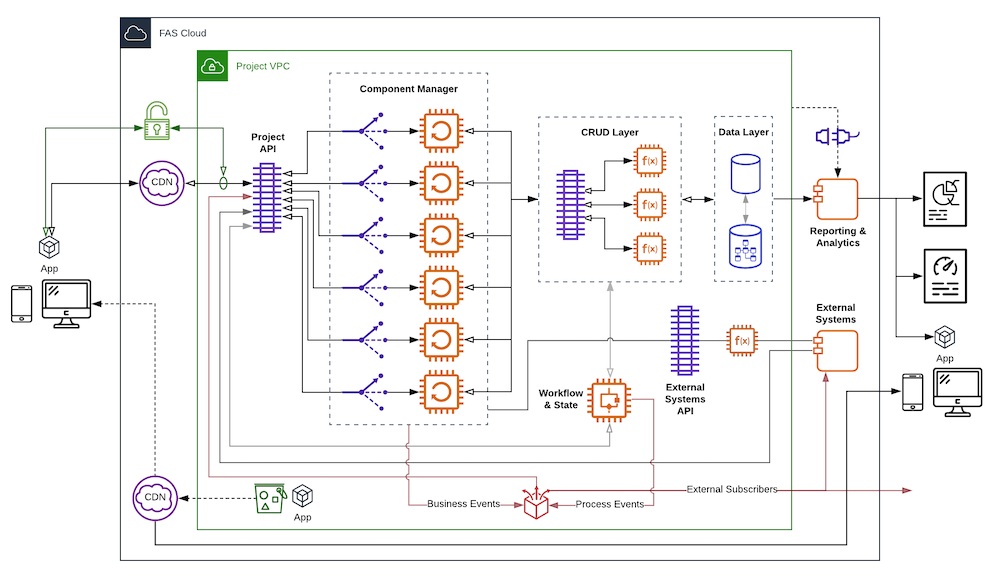
The "Transactional Macro-Pattern" is the workhorse of how most systems are designed to run on the cloud. This pattern is useful for most systems that require a user interface and the ability to store data. Use this pattern to talk through or evaluate an architecture for proposed or extant GSA systems. Reading through it from left to right starting at the computer/phone user devices you can see that:
- The app is pulled from an addressable storage point controlled by the Project VPC.
- A Content Delivery Network (CDN) can be used to deliver the app in a way that is most performant for a given user (wherever they are).
- The "app" then makes calls to an API that also might be exposed through a CDN.
- The API fronts capability-based components that are both scalable and load balanced.
- The components then interact with the back-end data stores through a CRUD layer API
- They also can interact with external systems through a purpose built API
- The data stores might also feed data to a Reporting and Analytics component that, in turn, feeds reporting and dashboard.
- Workflow and State management needs to be accounted for.
- Lastly, business and process events should be raised with an event bus collecting and handling them.
Example Use Cases:
- Data entry systems that provide a UI and store data in a database should probably use this pattern.
- Systems that find their best rendering in three tiers.
Orchestration Macro-pattern
This pattern is directly derived from the general "Pipes and Filters". In a classic Pipes and Filters implementation the filters are encapsulated such that the transformations that they achieve are relatively small and encapsulated; similar to way a data pipeline works with ETL jobs. At the macro-pattern level, these "filters" can be of any size, large or small, but generally we are looking at orchestrating the input and output of systems rather than simple transformations. The graphic tries to depict this complexity with different system types.

Diagram description, starting from the left:
- Data flows into the left green filter, which passes it into a containerized transactional system. That system produces a set of data files that are passed onto the next filter.
- The blue filter receives the green data and puts it though and analytics process that feeds into a data warehouse and object stores. Out of that, the blue data files are produced and passed onto the next filter.
- In between the blue and the purple filter is a decision point that can direct the blue data to either or both of the downstream filters (purple and pink). In other words, pipelines can have many branches.
- The purple filter feeds the blue through a set of serverless functions that organize it and produce purple data to pass on.
- The last orange filter takes in the purple data and routes it to a variety of subscribers.
- And so on ...
Consider using this orchestration pattern whenever data is being moved through your system. The main takeaway should be that each filter and pipe should provide encapsulated functionality and data. Use SLAs and a data catalog to manage the boundary around each. If you would like to read more, the FALCON team (formerly FSS-19) is developing a generalized strategy based on their modernization experience: FALCON Serverless Compute Model.
Example Use Cases:
- Many systems in the ecosystem are task focused. Use the orchestration pattern to supply such systems with the data that they need and publish the data that is needed by the rest of the enterprise.
- Internet of Things data could be collected and processed through an analytics engine. Use the orchestration pattern as a data pipeline to encapsulate the process and data sets.
Analytics Macro-pattern
Since GSA produces a lot of data and uses some external data, it's important to know how to handle it in a modern way. The Analytics Macro-pattern shows, at a conceptual level, just how this is achieved. Most systems will need to do "local" analytics to support reporting and dashboards, so use this pattern to discuss and evaluate solutions that are being designed, offered or planned.

Diagram description, starting from the left:
- Data enters the analytics engine through a data broker that can be anything from an API to a streaming service like Kinesis.
- During the ingestion process and while the data is still on the its way in, some sort of pre-processing might take place through a function.
- Once it is ready and available for consumption and processing, various functions will select and pull data into their respective process.
- The top process includes an ETL job followed by a machine learning model evaluation
- The middle process includes an initial ETL followed by either distributed processing or an addition ETL job with both ETL jobs enriched by reference data.
- The lower path to the data warehouse shows that there are times when lightly processed or filtered data can be made available almost directly for reporting.
- On the back end, apart from the eventing functions:
- The data within the data-lake and warehouse is made available for reporting, dashboards and ad-hoc application queries through an API
- The data is managed and controlled by data scientists who can influence the inner workings of the ETL, AI models and Map-Reduce processes.
- Lastly, the analytics system needs to embed eventing so that early warning, processed and filtered events can inform the enterprise when significant things happen.
Example Use Cases:
- A large amount of financial data needs to be joined with operations data to feed an executive dashboard. Use the analytics pattern to first simplify the data sets and then a map-reduce operation to join the data into a target data set that directly satisfies the dashboard needs.
- Identify user specific site usage patterns to improve usefulness of their interactions with GSA. Use the analytics pattern to collect user usage information and then a machine learning to identify usage patterns that will dynamically change site flow and visible options.
This is a very high level summary of the important parts of the FAS-IT architectural practice. For further reading, please see this site's Whitepapers.